Please note – All images below are clickable. Click to enlarge if the image is too small.
– Log In to Piktochart
– Click the Share button (top right)
– Select “Anyone Can View the Sharing Link”
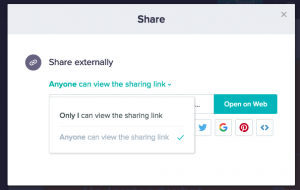
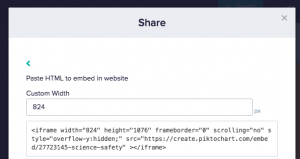
– Select the <> icon to get the embed code
– Copy the first (shorter) block of code
– Create a new page on your blog – “Infographic Assignment”
– Create a heading and introduction on the Infographic Assignment page
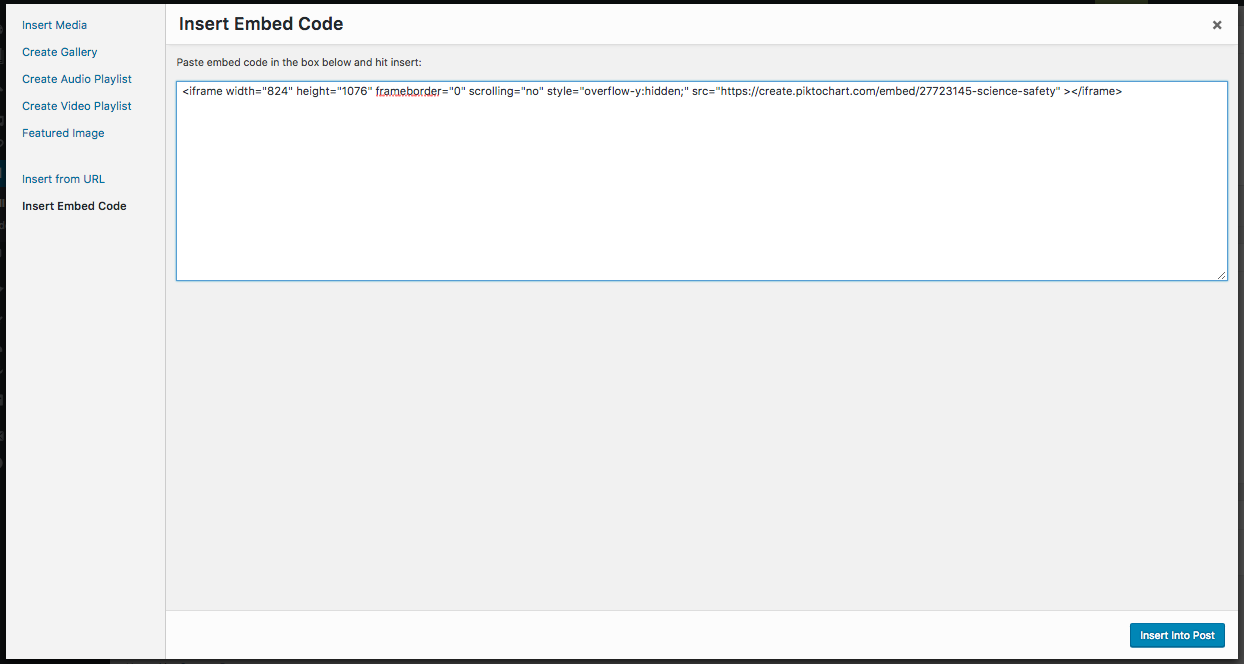
– Click “Add Media”
– Click “Insert Embed Code”
– Paste the code from Piktochart

– Click “Insert Into Post”
– Click the “Publish” button
– Copy the Permalink for the page
– Edit the “Digital Literacy 10” page
– Paste the permalink at the top of your Digital Literacy 10 page
– Click the “Publish” button